There are lots (and lots) of Open Source tools out there that claim to fill the “monitoring” slot, for a number of years (for example) I used something called ZenOSS, which had it’s ups and downs, but ultimately went commercial.
Enter - Zabbix
So, needing “something” I’ve recently looked again as the current Open Source options and found myself revisiting “Zabbix”, something I’d looked at before and concluded it was too much and not pretty enough. Unfortunately this looks like it might be the best of the bunch at the moment so I’ve had a crack at setting it up.
I didn’t find it easy!
However, I have come away with a live dashboard showing me all the information I want to see in relatively real(ish) time, and with the potential to add pretty much anything if I want to put the time in.
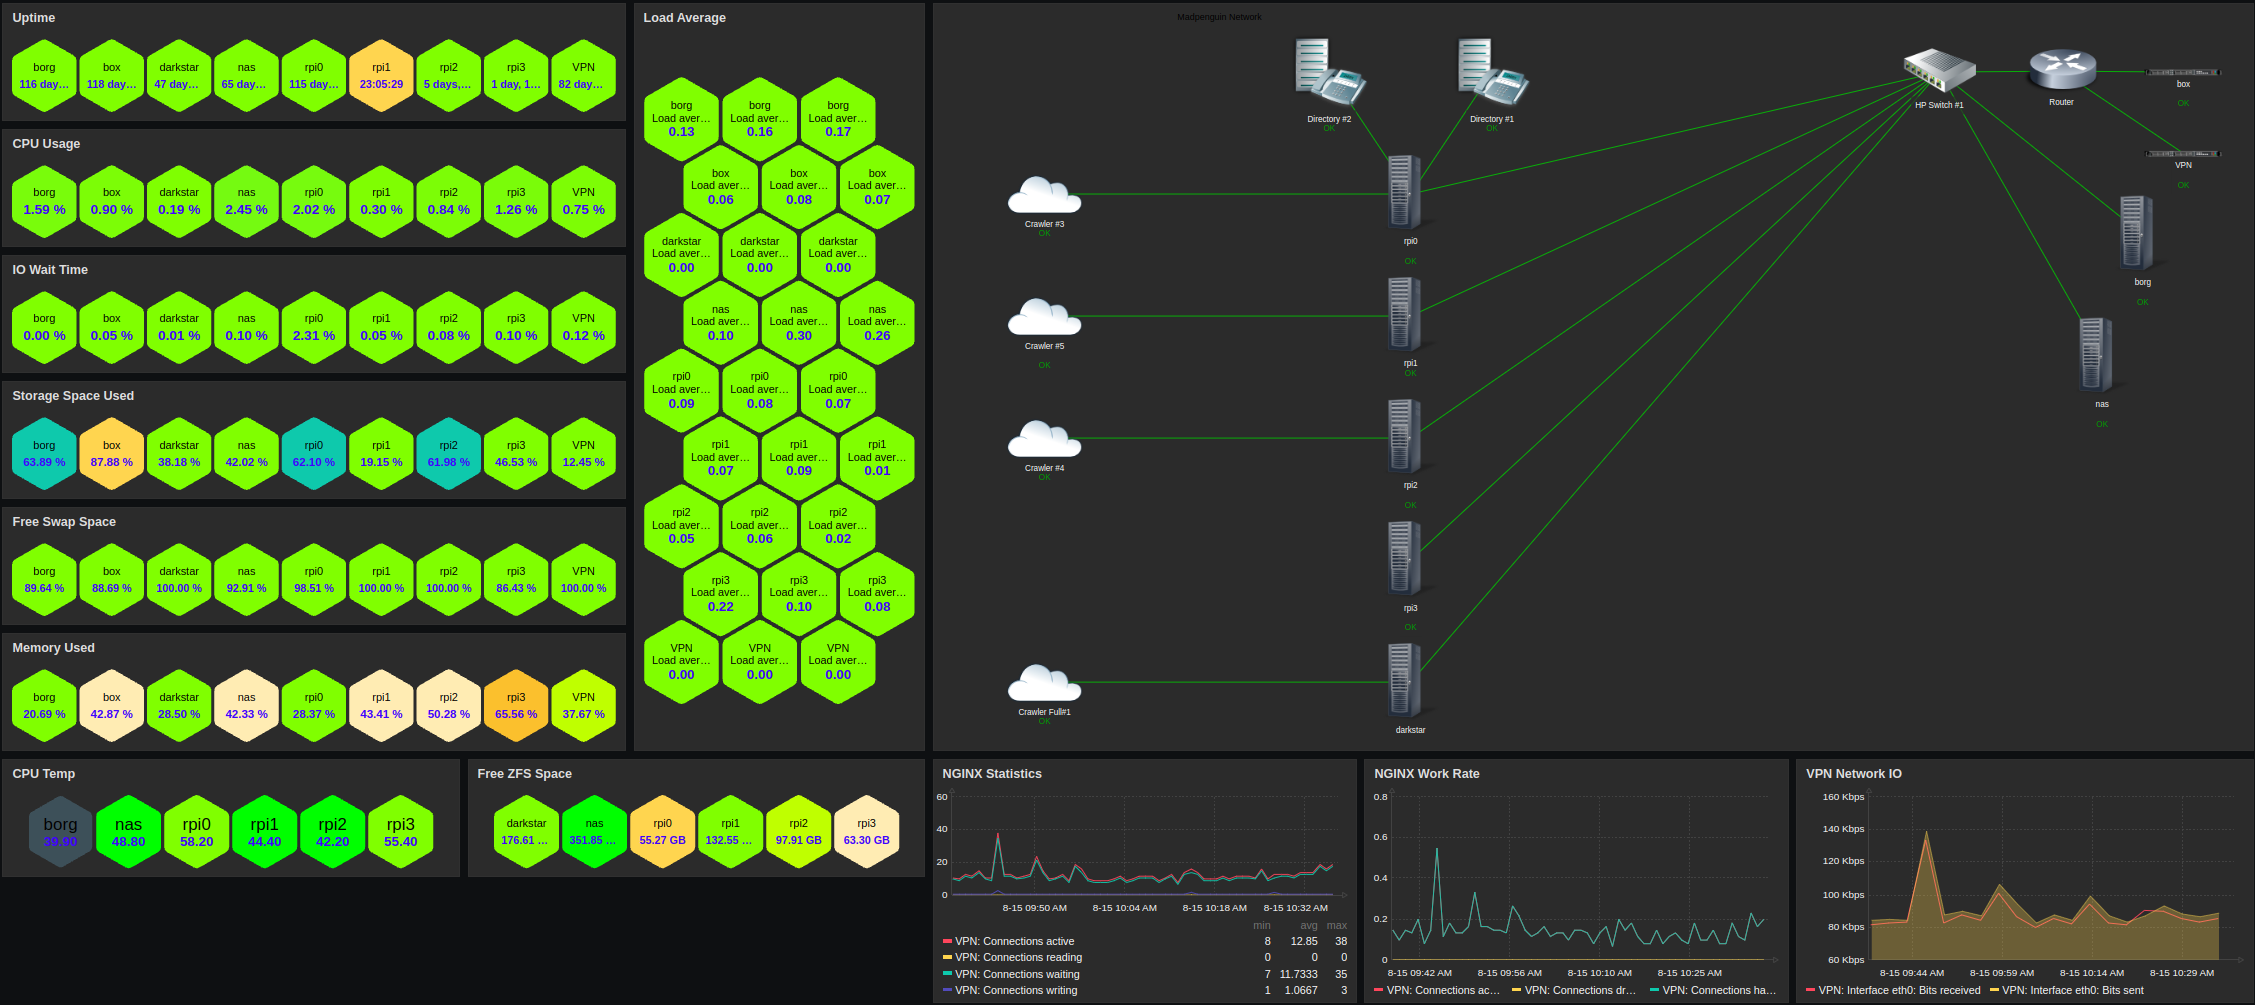
A dashboard
On this view I have a live map of a collection of machines (and containers) and if any parameter strays into warning or error the icon representing the machine in question is highlighted visually and with a audible klaxon.
I then have a bunch of charts showing the performance of the public facing NGINX reverse proxy and the throughput of the associated VPN.
Then I have all manner of useful visuals linked to a colour index, the closer to red they are the closer they are to being out of bounds and needing attention. The greener they are the less I have to worry about them. This includes CPU temperatute, swap space, disk space, load average, memory usage, IO wait times, CPU usage and uptime.
The mechanism for managing hosts is pretty good. When you add a new host you include it in a “group”, then the honeycomb displays simply the metrics for all hosts included in the desired group, and you can have as many dashboards as you like in terms of partitioning up large estates.
Note that dashboards are created from scratch by the user with whatever they want to see, anyone hoping for something that just displays all the good stuff, yeah, well, no.
ZFS
Ok, so some systems require more management than others - but for good reason. I recently swapped out three “new” SSD’s because they were dangerous to use, but I only knew about this because of ZFS and Zabbix.
Really?
What is a Checksum error?
If you read a block from a disk and it throws an error, a normal file-system can report on and deal with this. If on the other hand you read a block from a disk and it doesn’t throw an error, BUT the block read back isn’t the same as the block that was initially written to the disk, the file-system won’t necessarily know and you will essentially be using corrupted data.
Does this happen, well I have three new SSD’s here that say yes.
So how do you know?
One of the reasons people don’t tend to use ZFS is because it’s heavy in terms of relative resource usage and maintenance. However one of the reasons it’s so heavy is because it does lots of things you expect file-systems to be doing that they generally don’t do. One of those things is to checksum each block written to disk, and then when you read the block back, make sure the checksum is the same. i.e. making sure what you read was what you originally wrote. Sounds like a no-brainer, why doesn’t every file-system do that? Right? Well …
So under ZFS you can check a ZFS pool’s status like this;
rpi0:~ $ zpool status
  pool: pool
 state: ONLINE
  scan: scrub repaired 0B in 00:03:32 with 0 errors on Sun Aug 11 00:27:33 2024
config:

	NAME        STATE     READ WRITE CKSUM
	pool        ONLINE       0     0     0
	  sda3      ONLINE       0     0     0

errors: No known data errors
And if you have any checksum issues it will be immediately obvious. In my case, this isn’t a command I run frequently so I was clocking up checksum errors which ZFS was seeing, but I didn’t notice.
On adding those hosts to Zabbix it immediately flagged up three machines having checksum errors I didn’t even know about!
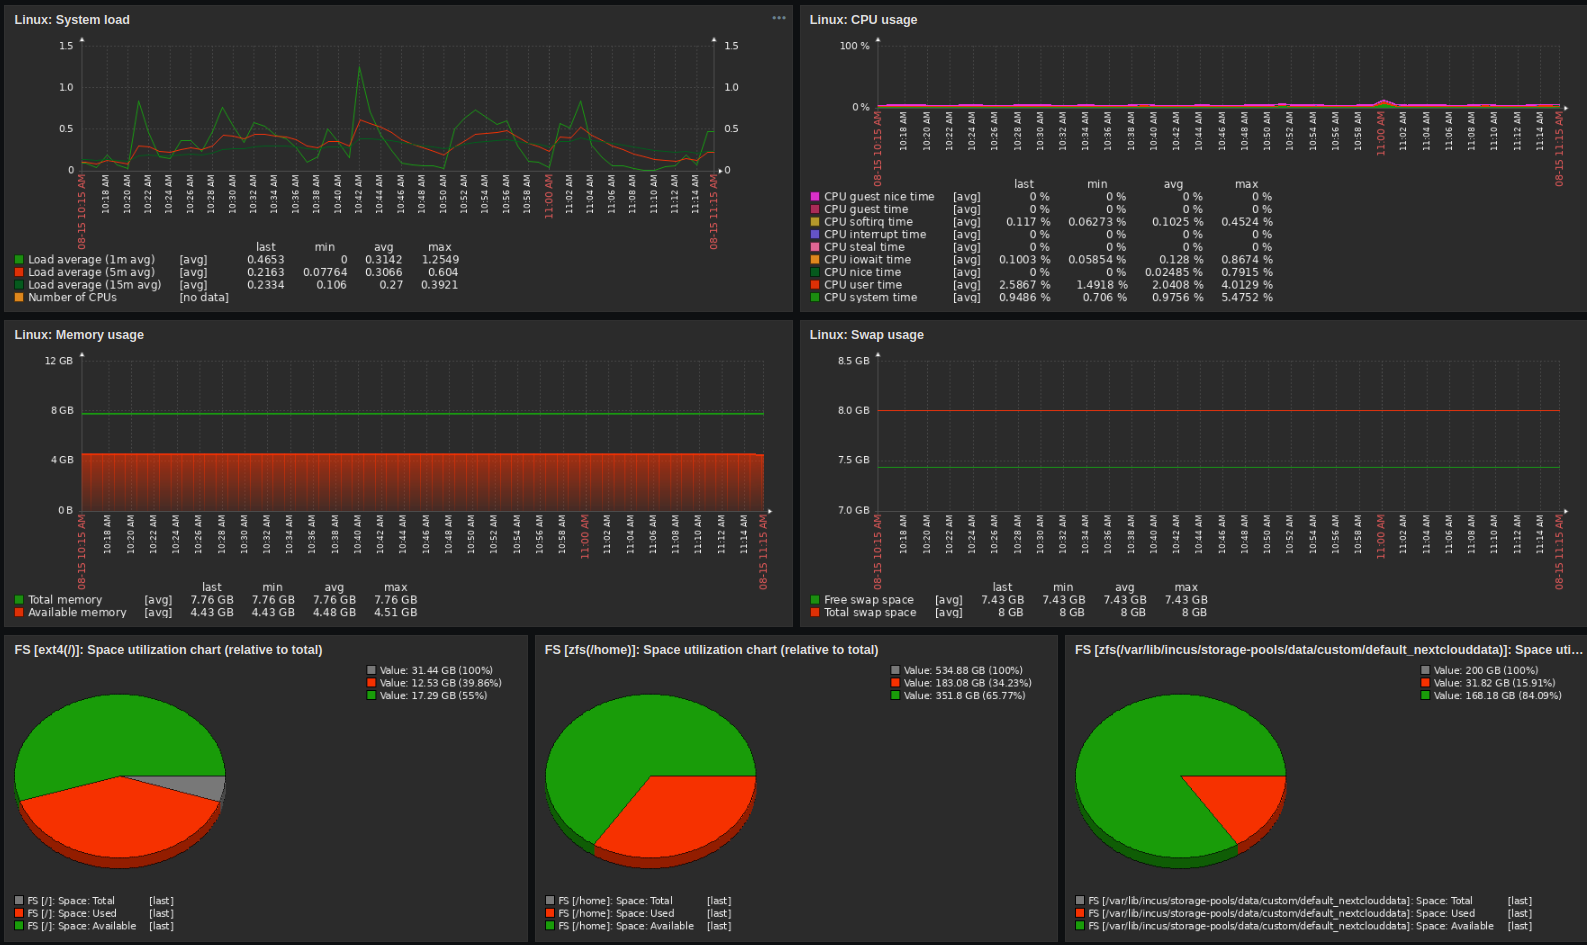
More detail
I’m saying that the dashboards are created by hand, they are but some detailed templates are available if you want to drill down by host;
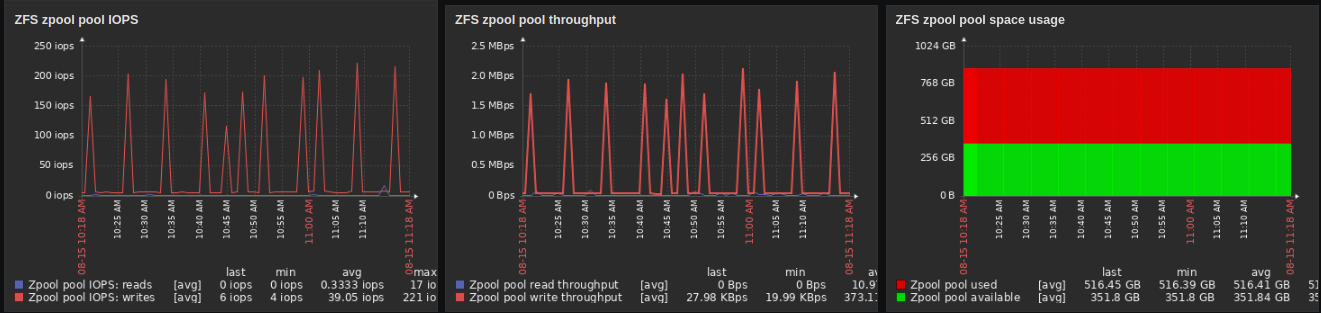
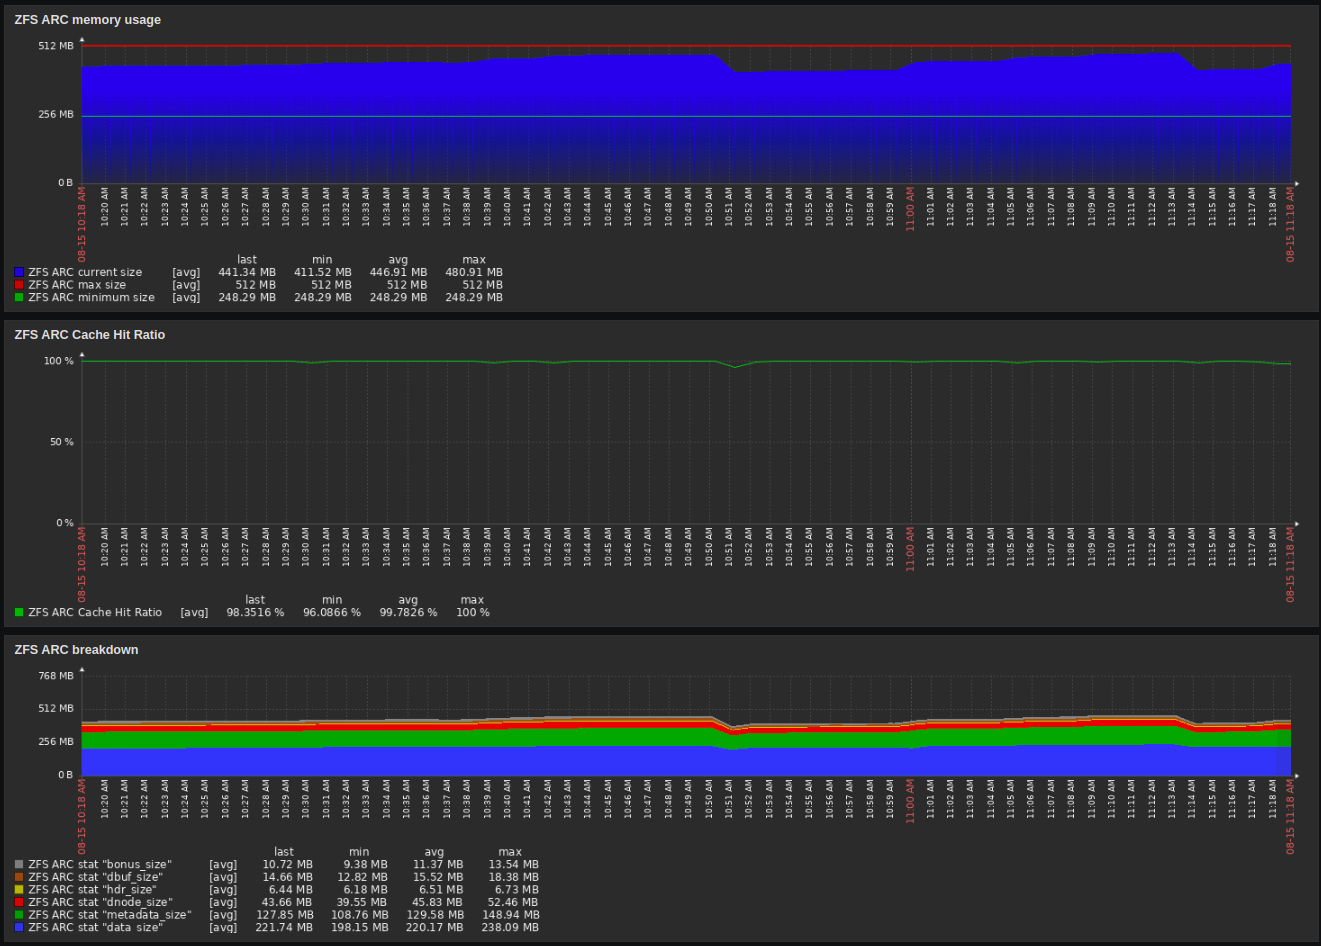
It’s also got some pretty useful stuff if you want to tweak your ZFS setup in more detail;
Summary
So if you’re using a potentially better Open Source monitoring system I’d be interested to hear about your experiences, but in the meantime if you need a comprehensive monitoring setup for your estate than with enough effort it would appear that Zabbix will do the job. It might not be the prettiest or easiest to administer, but if the aim is to keep the lights on then I guess the work is kind-of a secondary consideration.
1 post - 1 participant